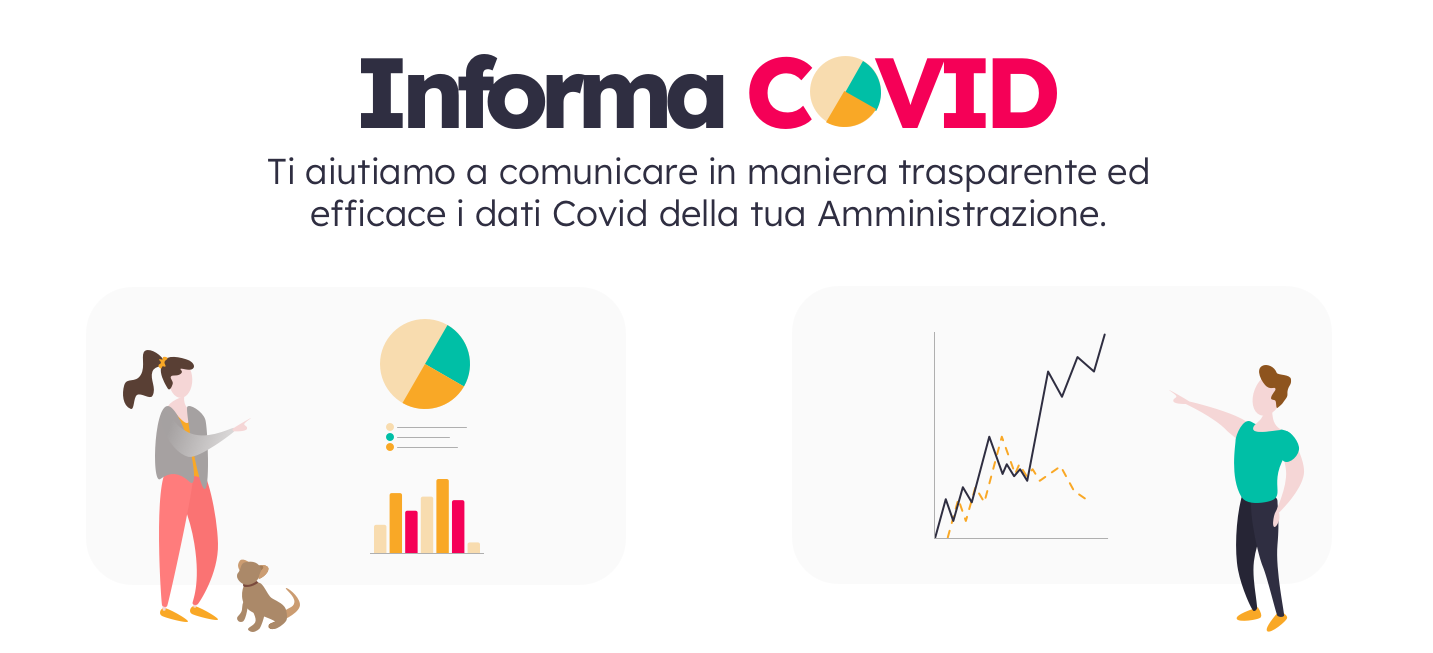
InformaCovid
Civic monitoring initiative to follow the progress of the coronavirus on a municipal basis through open datasets
Tool Self-Assessmet
- Reflect back on the objective of the tool you built: did you exceed it, or fall short? If so, why?
The toolkit is used by 32 Italian PA and it reached tens of thousands citizens who have been able to understand the real Covid situation interpreting data.
As a civic tool, the tool enables to make the COVID data, so data around the COVID the infections, and epidemiological situations are open and accessible to everybody. So that’s in the smaller scale, in the bigger scale, it enables better communication and more informed information for proceeding designs, so more informed decisions as well, also for political decisions, because when the data is clear, political decisions are, they can use more evidence towards Keeping the schools closed. They, of course, have the numbers better than to inform the citizens better. So I would say really, that the tool enables this, opening up the data, which in the long term means better information.
Some of the tools’ metrics for success are number of users and page views. To date, the dashboards with Covid19 data reached less than 10% of the population of the city we have data. The PA that uses the toolkit are 32 / 391 Sicilian municipalities.
I would say that we met the objective, we even exceeded it. Because we thought of just one or two cities, we’re going to pick it up. But we were, as I said before, happy with the results.
- What are the tools’ metrics for success and what does metric say – how well did the tool do?
Thanks to the information provided, there is no doubt that the toolkit has increased the awareness of part of the interested population. Probably we could improve the engagement by increasing the information program in order to be known by more Public Administrations.
Uptake, in this case, would really be uptake. How many people, how many citizens or how many public administration offices, actually picked it up and used it, and you can see it on the map there. Together with, of course, a little bit of press release, that mentioned the tool, which is always nice to have. But that doesn’t necessarily cover it all.
- Were your assumptions that the tool you built would: increase participation/engagement or tackle an issue/raise awareness correct? Do you think you chose the right approach – and what would you do differently?
Italian PA sometimes had difficulties in modifying previously uploaded data but the overall experience is positive. We didn’t receive any issues from citizens related to the dashboard.
The assumptions that we had, when we built these tools, was that it would increase participation, but also raise awareness. The way we are collecting and giving the data to the citizens is far from optimal. It’s prone to error. Nobody understands how we do it, there is no proper data notation. So all these things are merged.
- What are you hearing from users? What do they enjoy in tool? What do they find challenging?
As previously specified, the tool reached only a few Italian PA but it was very useful for them.
We had a couple of people telling us that they were experiencing an issue. But then because all the code is available online, they could raise issues, we could check those issues, and we could help them to solve it. But mostly, we had people that were very happy with the PDF guide, for example, because it’s really, step by step commented very clearly. So I think that the user friendliness of it has been proven. It’s a free tool that starts from a voluntary organization, and given also the cultural obstacles that we face in Italy, especially in the very south, I believe the uptake was promising .
- Did your tool deliver what you were hoping for? Are they useful for your key user audience? Are they being adopted?
It was a process that started not in the void. But already with a specific contact point, there was a need for it. And I think the need means that there was a target. And having the target means that we could develop a workflow that was easily taken up by the other cities as well. So this is what works very well that it started from a use case that already existed, we didn’t have to invent it.
- What worked well through the implementation process? What areas have room for improvement?
The implementation process is well described with different tutorials. The duplication phase of the project can be improved by automating some steps and easing the selection of the municipality.
Areas for improvement, I would say: bigger uptake. If something I could dream about is for people to be more sensitive about these things. But yeah, for that time, I think we can do more than what we do more outreach communication, but there are a small bunch of people doing mostly evening and weekend. works. So, as I said before, we’re happy with what we do. But areas for improvement – outreach, communication, dissemination maybe could be a bit better.
Tool ID
- GOAL:Informing citizens and municipalities on health emergency
- Made by:Open Data Sicilia
- Country:Italy
- YEARS ACTIVE:2020 – to date


